I know, I know. I’ve been banging on about the subject for some time now… well, ehr… since George Osborne uttered these seemingly harmless words ‘No caps. No drawdown limits. Let me be clear. No one will have to buy an annuity.”
And the reason I keep banging on about it is because sequence risk is perhaps the most significant risk for those looking to generate a lifetime income from a pension drawdown pot.
Sequence risk is the risk that the order of investment returns is going to be unfavourable. This risk exists at accumulation stage but it’s amplified by withdrawals from a portfolio during the retirement stage. If you get good returns in the early part of retirement, you’re unlikely to run out of money with a sensible withdrawal rate of say 4% or even 5%. If you get poor or even mediocre returns in the early part of retirement, the technical term is ‘buggered!’.
[bctt tweet=”If you get poor returns in the early part of retirement, the technical term is ‘buggered!’. ” username=”AbrahamOnMoney”]
Sequence risk is also what I call pound-cost ravaging. Returns in the early period of retirement have a disproportionate effect on the overall outcome, regardless of long term returns over the entire retirement period. And if it’s not properly managed, it can cause untold havoc.
To illustrate this, let’s look at evidence from actual historical data over the last 115 years, between 1900 and 2015, using the Dimson, Marsh and Stratton Global Investment Returns Database.
In this research, we need to explore the relationship between historical sustainable withdrawal over a 30 year period and real returns obtained over each of the 3 decades of retirement within that 30 year period. For this purpose, sustainable withdrawal rate is the percentage of the initial portfolio you could take from a portfolio and subsequently adjust for inflation, without running out of money over 30 years. So, for a £100,000 portfolio, a withdrawal rate of 4% gives you an annual income of £4,000 in the first year. The £4,000 then adjusted for inflation every single year over 30 years, regardless of portfolio size during those subsequent years. Thus, the withdrawal rate is expressed as a percentage of the portfolio balance only in the first year of retirement.
Approach
- I’ve expressed the sustainable withdrawal in monetary terms (rather than percentages) using the term ‘sustainable income’, based on a £100,000 portfolio. The sustainable income is the maximum annual inflation-adjusted income you can take if you want to run down the portfolio balances to zero at the end of 30 years.
- For this, I looked at every 30 year period between 1900 and 2015 inclusive. So the first 30 year period runs between 1900-1929, then 1901-1930, 1902-1931… and final 30 year period runs between 1986-2015. This gives 87 scenarios.
- The portfolio is composed of 50% UK Equities and 50% UK Bonds, rebalanced annually.
- No fee has been applied, because the point is to examine the relationship between returns and sustainable withdrawals. But when I retested the result with fees applied, the findings hold regardless.
- Finally, I examined the average real return in the first, second and third decades of each 30 year retirement period.
The Result
This first chart below shows the annual sustainable income (inflation adjusted) against the average real return in the first decade of retirement.
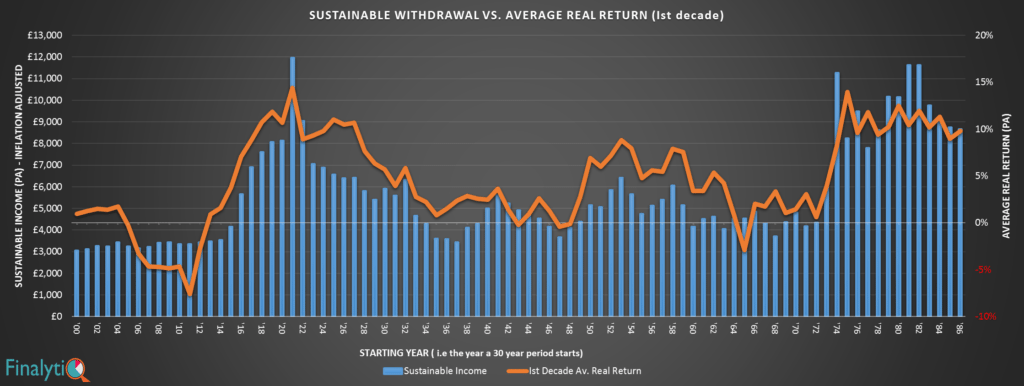
What you see in this first chart is a very strong correlation between return in the first decade and the sustainable income for the overall 30 year period. But look at the second chart below. It shows the annual sustainable income (inflation adjusted) against the average real return in the second and third decades of retirement.
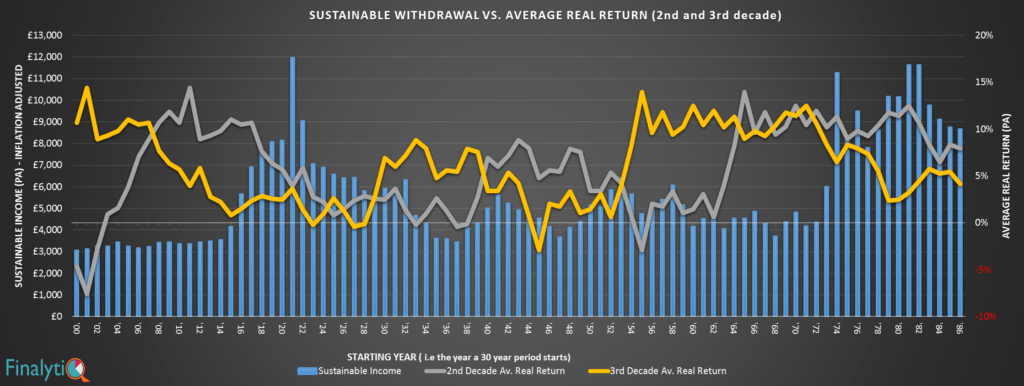
As you can see the relationship between the sustainable income over a 30 year period and the return in the 2nd and 3rd decade isn’t all that strong. And the final chart below is the earlier two charts combined. It shows the annual sustainable income (inflation adjusted) against the average real return in the first, second and third decades of retirement.
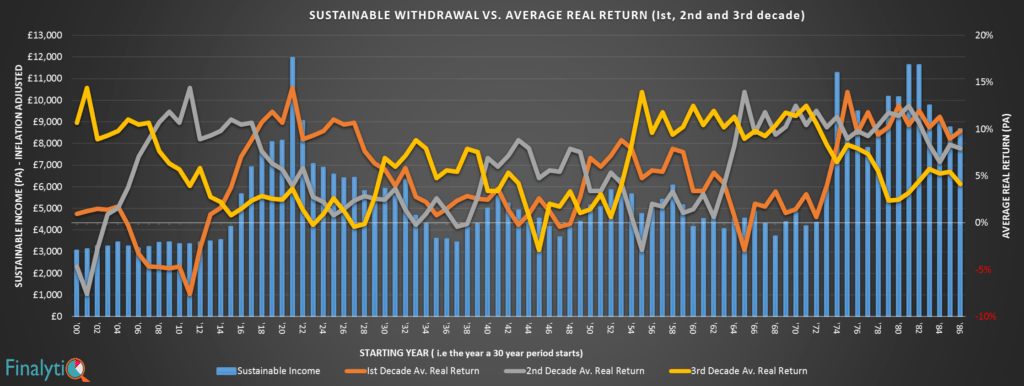
This result shows a strong correlation between sustainable income over any 30 year period and the average real return in the first decade of retirement. In years where the average real return for the first decade of retirement is high, the sustainable income over the 30-year period tends to be high. And vice versa.
Take for example, a 30-year period starting in 1921. The average real return in the first decade was nearly 14.4%, compared to 3.9%pa in the second decade and 3.6% in the third decade of retirement. Someone starting their retirement in 1921 could have enjoyed an annual income of £12,000, adjusted for inflation over the subsequent 30 years. (A whopping withdrawal rate of 12%!) Why? Because they had such a great first decade. The return in the second and third decades didn’t matter as much.
Take another example; a 30-year period starting in 1969. The average real return in the first decade was a meagre 1.44%, compared to 10.2% in the second decade and 11.7% in the third. Never mind fabulous double-digit returns in the second and third decades of retirement, the sustainable income over the 30-year period was no more than £4,533pa. (or a withdrawal rate of 4.5%)
The table below shows the correlation between average real return in each decade of a 30 year retirement and the sustainable withdrawal over the entire period.
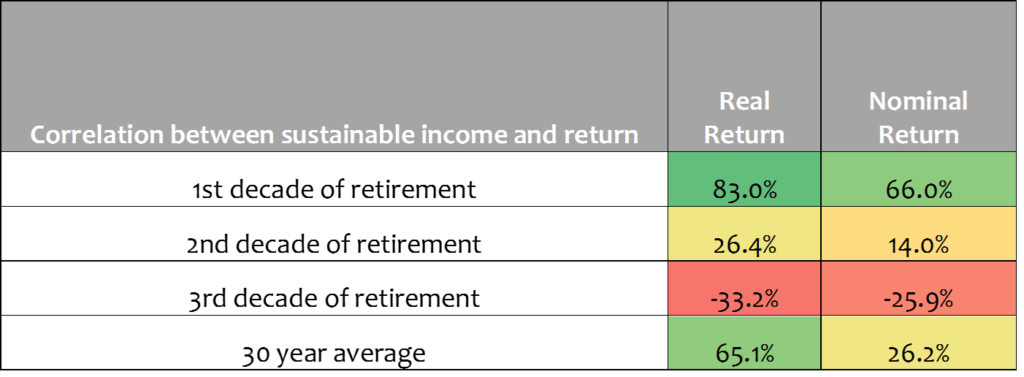
This table shows an 83% positive correlation between the sustainable withdrawal rate over a 30-year period and the real returns in the first decade of retirement! This compares to a 26% correlation between sustainable income and average real return in the second decade and a correlation of –33.2% (a negative correlation) to the average real return in the third decade of retirement.
The conclusion?
Return in the first decade of retirement is the main driver of sustainable income over the entire 30 year period.
Sequence risk is no bogeyman. Empirical data shows that it does exit. It’s vile and dangerous.
The crucial lesson here is that, your income over a 30 year retirement period is driven largely by the investment return you receive in the first decade of retirement. Accordingly, the early period of retirement is far more important that average return over the entire period. This means that the way you draw income from your retirement portfolio needs to be carefully managed, particularly in the early part of retirement. I’ll be exploring how to do that in the coming weeks.
Want more in-depth research-based insight on retirement income? Join us at the Science of Retirement Conference on the 1st of March, 2017.


He holds a Master’s degree from Coventry University and an alphabet soup of qualifications, including the Investment Management Certificate, Chartered Financial Planner, CFP and Chartered Wealth Manager designations. He was one of 5 finalists for the Professional Advisers Personality of Year Award 2015 but the award went to a more deserving winner, obviously!
Read Full Bio
That’s a great piece of work Abraham. Much has been said and written about sequence of return risk, but this is a fresh and different way of looking at it and proving it’s impact on the unwary!
Rather than taking a typical balanced managed approach, you can solve (to some degree) the problem of sequencing risk by by turning a portfolio on its side and solving for time. By holding low risk assets (cash and short/medium dated index-linked gilts) in the early years you can consume those assets first and replenish cash levels after periods of relatively strong returns. In weak markets, you can consume cash. The amount of cash held or length of time cash is held for is a function of an individual’s risk tolerance.
Thanks Chris. Interesting idea but I can be sure that it works until I see historical data that it works systematically in severe market conditions. Other research suggest that simply holding cash doesn’t work. Unless you are a fabulous market timer. See https://finalytiq.co.uk/does-cash-flow-reserve-reduce-pound-cost-ravaging-in-retirement-portfolios/
It’s not market timing exactly, as trying to time the market against just being in the market is likely to end up with poorer outcomes, it’s more about allowing mean reversion of markets to take place (as long as you believe that markets mean revert). People with lower risk tolerance will have shorter time horizons filled by low risk or risk free investments such as cash or matched index-linked gilts (for inflation protection over a given time horizon) with riskier equity type investments filling longer term needs. People with higher risk tolerance are happy to take on the extra risk and require less buffer from short term market fluctuations. By doing it this way you can constantly reassess the ability to take risk and how safe the draw is rather than blindly following a ‘safe withdrawal rate’
Pseudo Science. So you’re saying that you have much higher SVR if your first ten years are good ones – Is that a surprise?
Yup. The issue has been known by some for some time. See here https://paulclaireaux.com/risk-really-matters-retirement/
What interests me more are the various (and often curious) ways in which advisers argue for drawdown – especially at points like now where any reasonable assessment of markets would say that the ‘next period’ is likely to offer low or negative returns.
This is a ‘live’ issue for a friend of mine with a £400K pension pot
Thoughts?