One crucial but often forgotten point about Bengen’s Sustainable Withdrawal Rate (SWR) framework is that SWR is defined as a percentage of the capital only in the first year of retirement. Subsequent withdrawals in £ terms are adjusted for inflation, regardless of the outstanding balance in future years. So, in reality the actually current withdrawal rate in percentage terms will change from year to year as the outstanding balance and annual withdrawal changes. But the real withdrawal in £ terms remains the same as the income in the first year!
The two charts below show the nominal (left) and inflation-adjusted (right) annual income for Bengen’s baseline gross SWR of 3%, from a £100,000 portfolio based on all historical periods from 1900 to 2015.
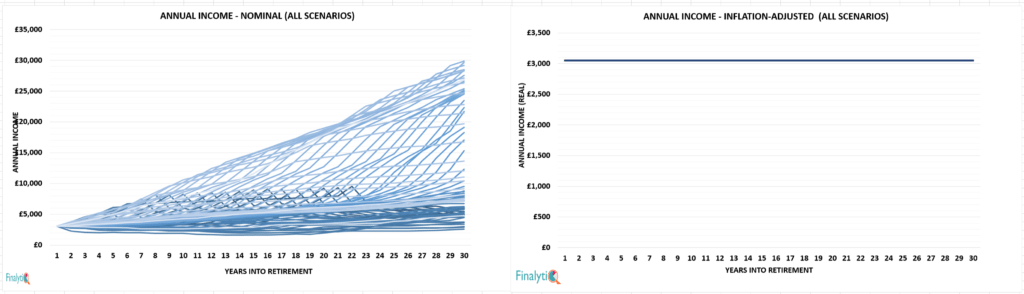
The second chart on the right which shows the inflation-adjusted income for all historical scenarios isn’t a mistake. It’s really a single line! This is because Bengen’s aim is that initial income in real terms will be maintained through out retirement, under all scenarios regardless of inflation or investment returns.
Inflation adjustment or not?
A common misconception about Bengen’s SWR is that the role of inflation adjustment is often ignored, forgotten or underestimated. And so, it is all too common, yet grossly inaccurate for people to compare Bengen’s withdrawal rates (which are inflation adjusted) to level annuity rates or guaranteed drawdown rates, which aren’t inflation adjusted.
[bctt tweet=”It’s grossly inaccurate to compare Bengen’s withdrawal rates to level annuity rates!” username=”AbrahamOnMoney”]
Accordingly, the question I aim to answer in this post is what’s the sustainable withdrawal rate if income isn’t adjusted for inflation? This is important, not only for purpose of comparison with level annuity and guaranteed drawdown rates but also as a withdrawal strategy in its own right. As discussed previously, research suggests that spending in retirement tends not to be static in real terms. On the contrary, spending tends to fall in real terms progressively during retirement. And indeed, over 90% of annuities purchased are fixed annuities, without any protection against adjustments.
[bctt tweet=”What’s the sustainable withdrawal rate if income isn’t adjusted for inflation?” username=”AbrahamOnMoney”]
Accordingly, fixed or level withdrawal strategy defines withdrawal as a percentage of the initial portfolio and subsequent amounts aren’t adjusted for inflation. For instance, a fixed withdrawal rate of 5% from a £100,000 portfolio will produce an income of £5,000 in the first year. The retiree takes an income of £5,000 p.a. regardless of the portfolio value in subsequent years, with no adjustment for inflation. This strategy accurately mimics income from level annuities and guaranteed drawdowns, which isn’t adjusted for inflation.
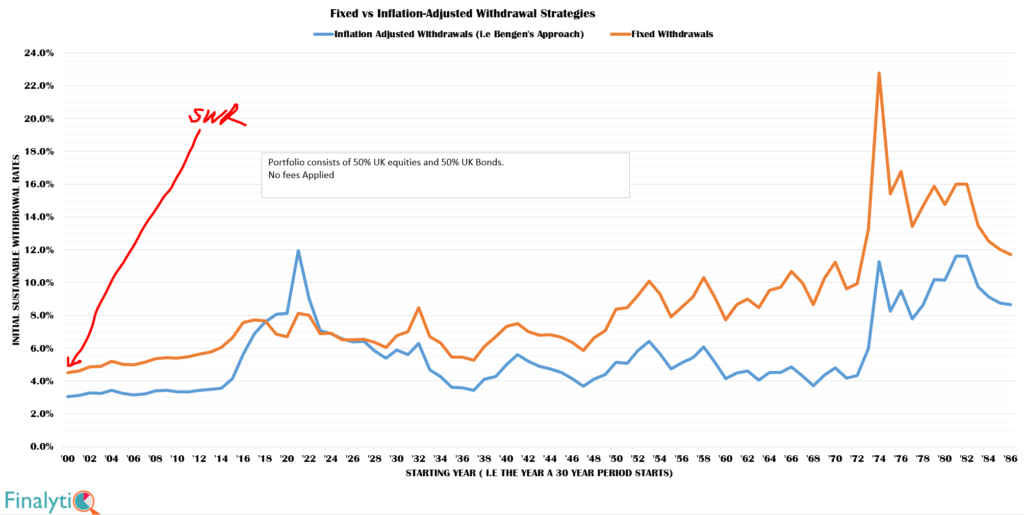
The chart below shows historical sustainable withdrawal rates over all rolling 30-year periods, for fixed withdrawals vs Bengen’s inflation adjusted withdrawals. It shows that a gross withdrawal rate of 4.5% (before fees) is the historical worst case scenario for retirees opting for fixed withdrawals. This compares to 3% for inflation adjusted withdrawals.
Even after accounting for the impact of a 1%pa in fees, the a 50/50 UK portfolio still supports a net fixed withdrawal of 4% of the initial portfolio over a 30 year period in the historical worst case scenarios.
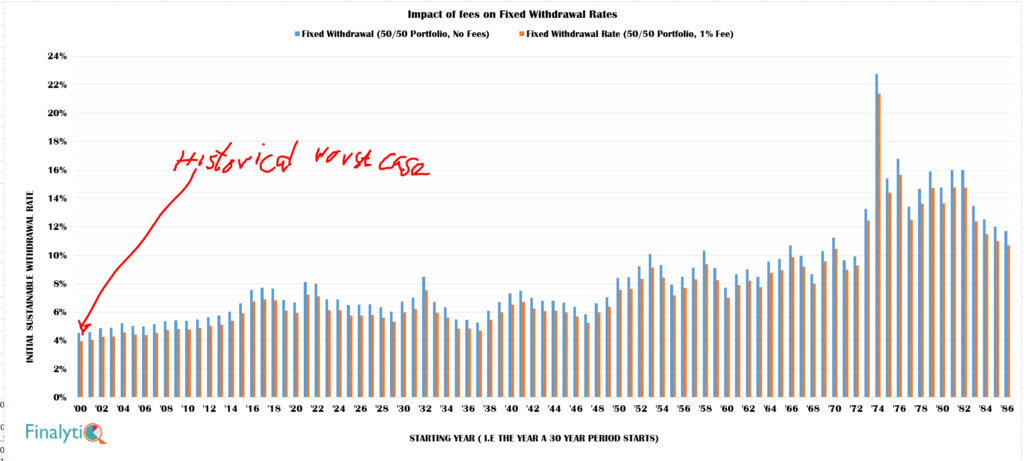
Think about that for a minute. If (and it’s a big IF) a retiree isn’t keen on adjusting their income with inflation, a withdrawal rate of 4% of their initial portfolio lasted at least 30 years, even after accounting for 1% fee. And that’s the historical worst case! In 80% of historical scenarios, a fixed withdrawal rate of 5%, again not adjusted for inflation, lasted at least 30 years, even after accounting for a 1%pa in charge.
But… But…
This sounds great? Where do I sign?
Not so fast…
Most retirees tend to spend progressively less as they get older. But with a fixed withdrawal approach, there’s the danger that the real value of their will fall faster than their expenses. To understand the impact of inflation, we can compare the real income under this fixed withdrawal (FW) with Bengen’s constant inflation adjusted withdrawal (CIAW) strategy.
For this comparison, consider two hypothetical retirees – each with a portfolio of £100,000. One adopts Bengen’s CIAW method of taking £2,600p.a. from his portfolio, which is then adjusted for inflation every subsequent year. Our second retiree adopts the FW approach, taking £3,950p.a. from his portfolio but it’s without adjusting for inflation in future years. Let’s consider the impact of inflation on their incomes during the retirement period, by selecting three scenarios from the data set.
- Cliff Edge Scenario: This is the 10th percentile historical scenario. Think of this as one of the very worst 30 years scenarios since 1900. The hypothetical retiree experienced very poor sequence of return and vey high inflation. 9 out of 10 historical scenarios were better than this.
- Comfy Scenario: This is the 50th percentile or median historical scenario, with relatively modest inflation and good sequence of return. Half of historical scenarios will be better than this.
- Cloud 9: This is the 90th percentile historical scenario. This is one of the very best historical scenarios for retirees since 1900. Our hypothetical retiree enjoyed very good sequence of return and subdued inflation. Only 1 in 10 historical scenarios are better
The chart below compares income with Bengen’s CIAW and the FW method in the 3 scenarios.
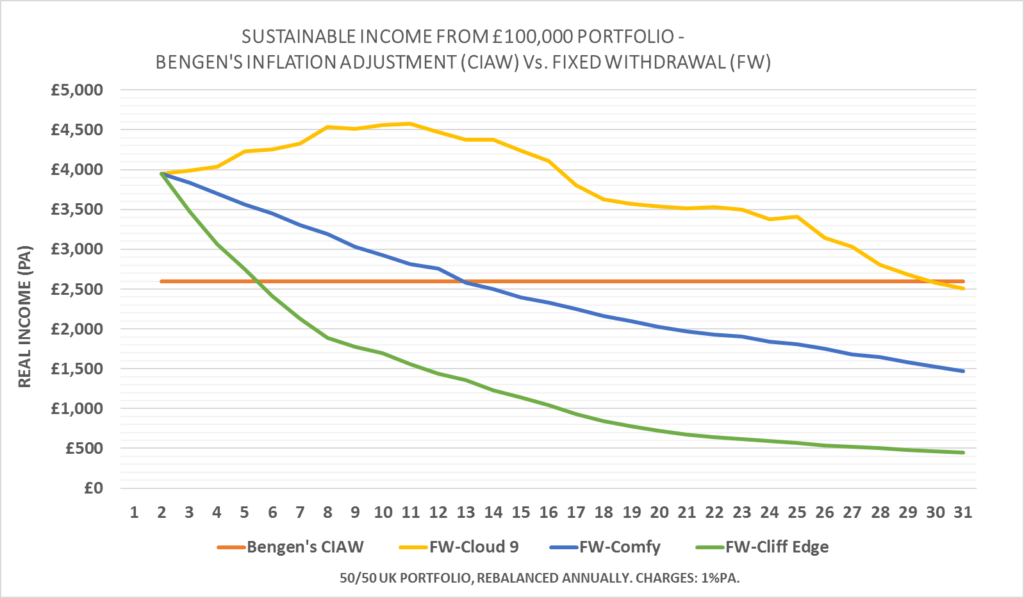
Under the Bengen’s CIAW approach the real income of £2,600p.a. is maintained under all the historical scenarios. Hence, only a single straight is shown to represent all the 3 scenarios because the income is the same.
Under the FW approach, real income starts at a much higher level – £4,000p.a., but this declines rapidly under both the Cliff Edge (10th percentile) and Comfy (50th percentile) scenarios, thanks to the impact of inflation. These represent a decline of 73.6% and 40.9% respectively in real income by the 15th year in retirement!
Ouch! That’s way more than the typical spending decline of 35% from age 65 to 80. I susspect most retirees will consider this unacceptable.
But over 90% of annuity purchases are level annuities and virtually all guaranteed drawdowns offer no inflation protection whatsoever. So, it appears that inflation risk is one that many retirees are either happy with or forced to accept. This may be because this decline in real income is compensated for because their the State Pension tends to keep up with or exceed inflation.
So What?
The implication of this is that, if a retiree adopts the fixed percentage withdrawal, they can spend more in the early part of retirement than the Bengen’s baseline withdrawal rate. But the impact of inflation on their income may be too much for them, particularly if inflation becomes aggressive. Nonetheless, the fixed withdrawal approach remains a valid withdrawal strategy in its own right and planners should at least explore the option with clients.
Another point is that, when comparing SWR to level annuity or guaranteed dradwown rates, the Fixed Withdrawal rate approach should be used rather than Bengen’s inflation adjusted withdrawal rates. Otherwise, the comparison will be grossly inaccurate.
Want more in-depth research-based insight on retirement income? Join leading academics, researchers and financial planners at the Science of Retirement Conference on the 1st of March, 2017.

,
.
.

He holds a Master’s degree from Coventry University and an alphabet soup of qualifications, including the Investment Management Certificate, Chartered Financial Planner, CFP and Chartered Wealth Manager designations. He was one of 5 finalists for the Professional Advisers Personality of Year Award 2015 but the award went to a more deserving winner, obviously!
Read Full Bio
I am still to find a client in a real world who withdrew religiously each year a nominal amount or an amount increasing with inflation as this wonderful theory tries to find an answer.
Withdrawals tend to vary from one year to the other and they are usually discussed at the annual review. The discussion starts with the need for income and clients have different expectations, but rarely these match the 3.5% or 4% SWR. It would have been easy if it was like that.
Things start to come into the discussion – new boiler, daughter wedding, replace a car, Ferrari 308 GTB – believe me I heard it all. Some people are nice and ask “Do you think it is possible?” others are a bit more pushy. Some were planned and accounted for in a way or another in the financial plan, some will just come out of nowhere.
Looking back, my clients expenditure looks more like a barbell. There is little research on how to deal with this. There is a lot of research on SWR for constant income, but little beyond this.