If I had a pound for every time someone in financial services talks about spending in retirement as being ‘U-shaped’, I’ll probably have enough money by now to never have to work again!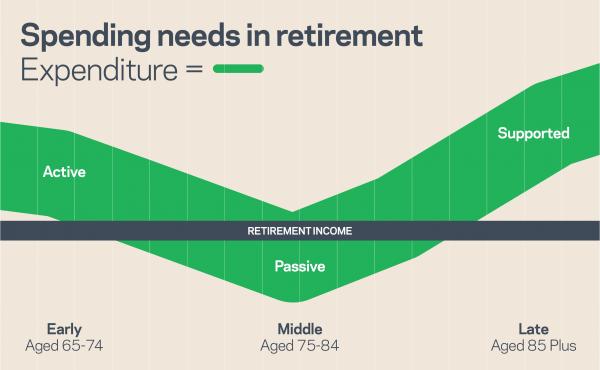
You’ve probably seen this image on spending needs in retirement before. It’s a rather commonly held view (see this, this and this) that most people spend more early in retirement, when they’re active and keen to enjoy their new-found freedom. Then they go into a less active stage where spending declines, only for it to pick up dramatically in later life due to care costs.
Sounds logical, right?
The trouble is, for the majority of people, this idea of ‘U-shaped’ spending in retirement is but a myth.
For some time, researchers have identified an important phenomenon known as the ‘saving puzzle’ – older people keep accumulating assets in retirement and the amount of money they save increases with age!
Dr Brancati and her colleagues at the International Longevity Center – UK recently conducted a detailed analysis of two large datasets namely, the Living Costs and Food Survey and the English Longitudinal Study of Ageing to gain insight into income and expenditure patterns of the older population. Their findings are set out in a recent paper titled Understanding Retirement Journeys: Expectations vs reality. The researchers note the absence of the U-shaped spending in retirement…
Our findings suggest that typical consumption in retirement does not follow a U-shaped path – consumption does not dramatically rise at the start of retirement or pick up towards the end of life to meet long-term care related expenditures. At this point it should be noted that our data is restricted to households only and therefore excludes those actively living in care homes who may be paying for it from their remaining assets. Yet we can explore the extent to which care expenditures eat into household budgets across different ages. Analysis of the data suggests that even for the 80+ age group, only a minority (6.4% of households) are putting money towards meeting long-term care needs. This doesn’t mean that U shaped consumption in retirement is a misnomer, but perhaps implies that it is atypical.
[bctt tweet=”Typical consumption in retirement does not follow a U-shaped path!” username=”AbrahamOnMoney”]
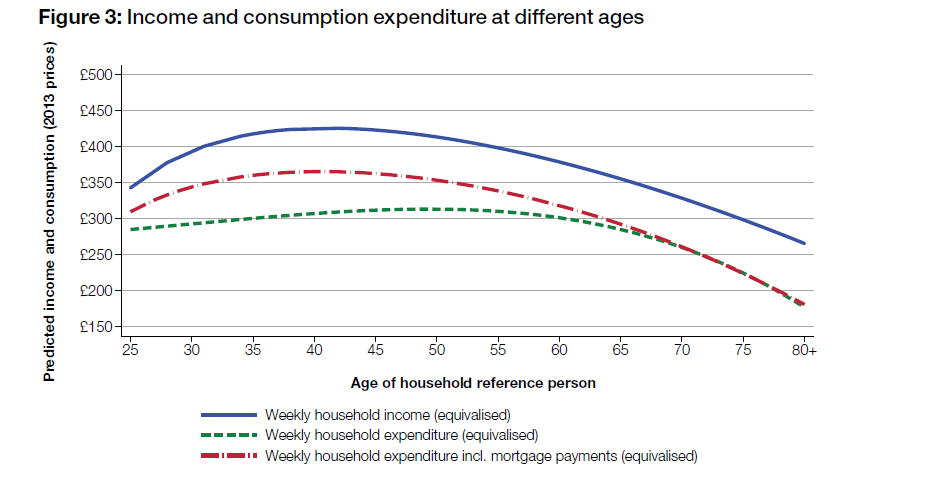
As it turns out, spending in retirement actually declines progressively in real terms. As people get older, they spend progressively less!
A household headed by someone aged 80 and over spends, on average, 43% (or £131) less than a household headed by a 50 year old. If we include the amount of money people pay for their mortgage as household expenditure, then the decline becomes even steeper with households headed by someone aged 80+ spending 56.4% less (or £173) than households headed by a 50 year old. Indeed, we calculate that by age 80+, individuals are saving, on average, around £5,870 per year!.
The next chart below shows that, from age 65, spending typically declines progressively and is about 35% lower at age 80.
Even when researchers split people aged 50+ between top and bottom earners (i.e. people whose income is either above or below the median), the trend remains broadly consistent. People spend progressively less as they get older. However, high earners experience a much faster and steeper decline in spending after age 60 than bottom earners. Indeed, bottom earners have more stable spending patterns throughout their lifetime, and their total expenditure starts to decline only after age 70.
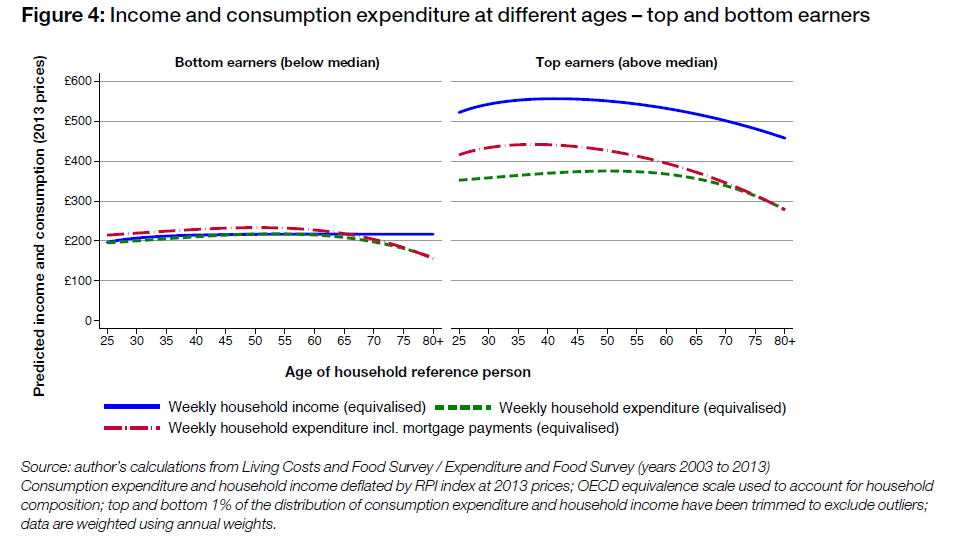
The authors concluded that older people spend consistently less than their younger counterparts regardless of their income. This trend is persistent and it’s not a periodic effect.
‘Consumption in retirement starts relatively high and ends low. This pattern is common to both high and low income groups, is robust to the inclusion of factors other than age and is not simply the result of the time period in which the data was collected.’
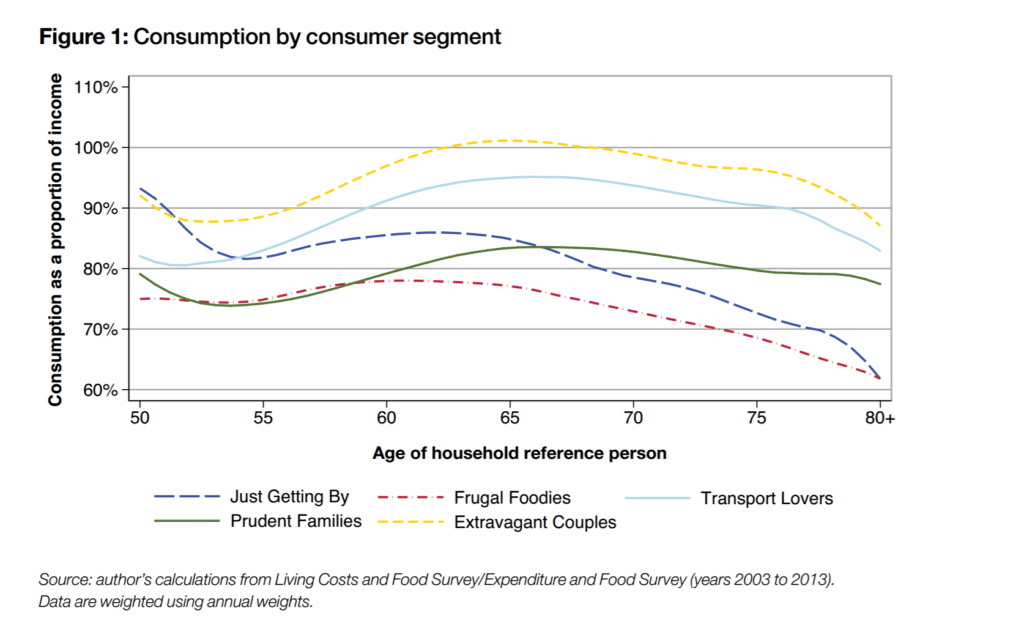
Amazingly, this trend is broadly consistent even when you look at segments of people with different lifestyles. The authors note that even the “Extravagant Couples” – those who spend nearly 40% of their total expenditure on recreational goods and services – spend more than their income in the first decade or so of retirement, as do those who are “Just Getting By”, while the “Prudent Families” and “Frugal Foodies” consistently spend below their income over the duration of retirement
All of the groups save in later life. From age 75 onwards, even the “Just Getting By” group, which is the lowest income group, starts to save. The savings are the consequence of falling consumption towards the end of life on non-essential items.
These findings are consistent with findings in the US, where researchers found that retirement spending tends to decrease by at least 1% a year in real terms throughout retirement!
Of course many people will need care in later life, but this is not typical. Consider the following data from Age UK (2016).
- only 16% of people aged 85+ in the UK live in care homes
- the median period from admission to the care home to death is 462 days. (15 months)
- around 27% of people lived in care homes for more than three years, and
- people had a 55% chance of living for the first year after admission, which increased to nearly 70% for the second year before falling back over subsequent years.
- approximately 30% of people use some form of local authority funded social care in the last year of life
While it’s important to factor in possible care costs into a retirement income plan, the chances that someone actually ends up having to pay for care are relatively low. In any case, it’s entirely practical for people to rely on their property wealth to meet care costs in later life, as Paul Lewis elegantly argued in his recent piece. And while it may not always be ideal, local authority funded social care remains the last resort under current law.
Want more in-depth research-based insight on retirement income? Join leading academics, researchers and financial planners at the Science of Retirement Conference on the 1st of March, 2017.

So what?
The assumption that income withdrawal needs to keep up with inflation throughout the entire retirement period is not supported by empirical data on spending pattern in retirement. This has a major implication for how we calculate sustainable withdrawal from retirement portfolios. An ideal sustainable withdrawal strategy should follow the typical spending pattern in retirement. This allows higher withdrawal at the early part of retirement and should progressively fall (at least in real terms) over their retirement period.
[bctt tweet=”An ideal withdrawal strategy should follow the typical spending path in retirement.” username=”AbrahamOnMoney”]
A major weakness of first version of the sustainable withdrawal rate framework developed by Bill Bengen is that it assumes expenditure remains constant in real terms throughout retirement. This is inconsistent with research findings on how consumption actually changes in retirement.
Thankfully, a range of flexible withdrawal strategies have been developed to reflect likely changes in retirement spending. I’ll be exploring these strategies over the coming weeks.
Keep reading…
.

He holds a Master’s degree from Coventry University and an alphabet soup of qualifications, including the Investment Management Certificate, Chartered Financial Planner, CFP and Chartered Wealth Manager designations. He was one of 5 finalists for the Professional Advisers Personality of Year Award 2015 but the award went to a more deserving winner, obviously!
Read Full Bio
I would like to make a case for the defence! My view is that the problem with dismissing the generalisation of a U-shaped expenditure pattern because it doesn’t fit with the “whole data-set” methodology being used in this research is that you can overlook the effects on certain sub-sets.
One of the important points – which you allude to in your article – is that there are many households where any care costs will be picked-up largely or wholly by the State as they do not have the assets to make them self-funders. For these households expenditure patterns will not rise towards the end of life; similarly we can expect that many will not have the assets / wealth to fund a sudden increase in expenditure in the early years of retirement either, so their expenditure patterns will follow the steadily declining path outlined. My parents are a classic example of this phenomenon.
Many planners do not deal with these households, however!
My experience as a planner dealing with wealthier clients is that their expenditure patterns do experience a sudden peak in the early years as they use tax-free cash to do-up the house, take 3/4 weeks to visit the children who now work on the other side of the world, take the luxury cruise they wanted, or just go on holiday more than 2/3 times a year. Then their expenditure patterns decline (as with everyone else’s) . My older sister is a classic example – when she and her husband retired they went on holidays to the Far East, Aus/NZ, USA, Latin America; now they’re older and can no longer manage 14 hours on a plane they go to the Canaries, Venice, Rome, Cyprus!
The reason many planners build in U-shaped expenditure plans with these clients is precisely because they are in the sub-set of the whole who will have to self-fund, and we need to make them aware that if they are unlucky enough to have picked one of these reverse lottery tickets, it could have serious implications for any other objectives such as passing on wealth to children / grandchildren (and also whether they can do this whilst alive or are better waiting until death).
I agree with everything Kevin has said. My wife is an IFA, Solla qualified ( only 2% if UK IFA have this qualification) specialist in dealing with elderly clients, many of whom are retiring, in care homes or going into care, often with dealing with a deputy (solicitor) or an attorney. Her clients are by their very nature wealthier than the vast majority of post retirement people, with substantial assets, a house (to sel/downsize) and or (very)good pension benefits. These are the people IFA’s tend to deal with because they need advice, unlike those who have little or no assets and will automatically fall into the care of the state (which is struggling to do so on the fees they receive, but that is another story entirely). With these clients, who will almost certainly be self funder’s at some stage for their care needs, she puts plans in place as early as possible to cover all aspects of their spending patterns, taking account of the spike later in retirement for care fees (many private care homes charge well over £50,000 pa and for full time care at home we have had a client paying over £200,000 p.a until her death last year!) . These plans include providing for the usual holidays and capital spending on new cars/ caravans/house refurbishment etc. These clients frequently fit the U curve spending pattern, just because they are going to be self funding their later life care! Dealing with clients in the real world, not some hypothetical group of homogeneous people is the key to why this research is skewed, and therefore in the real world of financial planning advice, fatally flawed.
The case for me being schisoprenic – I agree with both Kevin and Abraham as I have a small but very broad client base. Many like Kevin (where we are paid most of our money) and the latter who can’t afford their own care in laer life where we earn money we don’t get paid (our choice).
Our job as advisers is to help our clients identify which extreme they fall in to and for those with enough money, we become their “permission givers” to spend, spend, spend their own money whilst they have their good health early retirement as they can’t take it with them.
Those with less often require the most work as it is so much more of a balancing act.
For those where there are no children in the background, the decision making process is again completely different.
I think what we need to do is ensure we treat all clients as individuals and have an open enough mind in order to tailor our plans to what THEY want and NEED rather than what we think is right or wrong.