In the late 1600s, William III introduced the so-called Window Tax, a levy on people living in homes with more than six windows, a crude measure of prosperity at the time.
 To avoid this tax, some homeowners responded by bricking up all windows except the six! As the bricked-up windows prevented some rooms from receiving any sunlight, the tax was referred to as ‘daylight robbery‘, because it was considered to be a tax on light and air!
Today, we published the 2017 edition of The Multi-Asset Fund Guide titled The Gravy Train. A key conclusion of the report is that the vast majority multi-asset fund manager delivers worse risk-adjusted return than a simple market portfolio. And they charge clients very high fees for the privilege.
To put it bluntly, it’s daylight robbery! Sadly, just like the Window Tax, it’s entirely legal. Strangely, the tax remained in place for more than 150 years and was only abolished 1851! If that record is anything to go by, multi-asset fund managers are probably rubbing their hands with glee!
The median OCF for a multi-asset fund is 1.1%p.a! 25% of multi-asset fund ranges have an OCF of 1.4% or more! This is before the platform fee and adviser charge. Once these are added, the total cost of ownership for is north of 2.3%.
Cost isn’t a huge issue if multi-asset funds deliver an excess risk-adjusted return, over and above a simple market portfolio. It breaks our heart to tell you, for the second year, that they don’t. Nearly all the multi-asset fund ranges underperformed against the benchmark market portfolio and its real-life equivalent, Vanguard LifeStrategy range over a 5-year period. This wasn’t in one or two funds; it was at all risk levels over a three and five-year period.
[bctt tweet=”The median OCF for a multi-asset fund is 1.1%p.a! A quarter of the have an OCF of 1.4% or more!” username=”AbrahamOnMoney”]
The Efficient Frontier for Multi-Asset Fund
For this research, we examined the performance of 69 multi-asset fund ranges and the benchmark market portfolio dubbed the ‘No-Brainer Portfolios’.
The No-Brainer Portfolios are based on the concept of the ‘market portfolio’, the natural benchmark for any multi-asset portfolio is one based on how investors across the world allocate capital across publicly traded financial assets. Each No-Brainer Portfolio is made up of a percentage allocation to two asset classes – equities and bonds, depending on the investor’s risk profile. 0.50%p.a. and are rebalanced once a year.
The idea behind the benchmark portfolio is very simple; create a passive portfolio in its purist form that allocates to market cap-weighted global equities and bonds, depending on the degree of risk an investor is prepared to stomach. In other words, they would take whatever return the market gives them rather than trying to make active predictions about which assets will perform better than others.
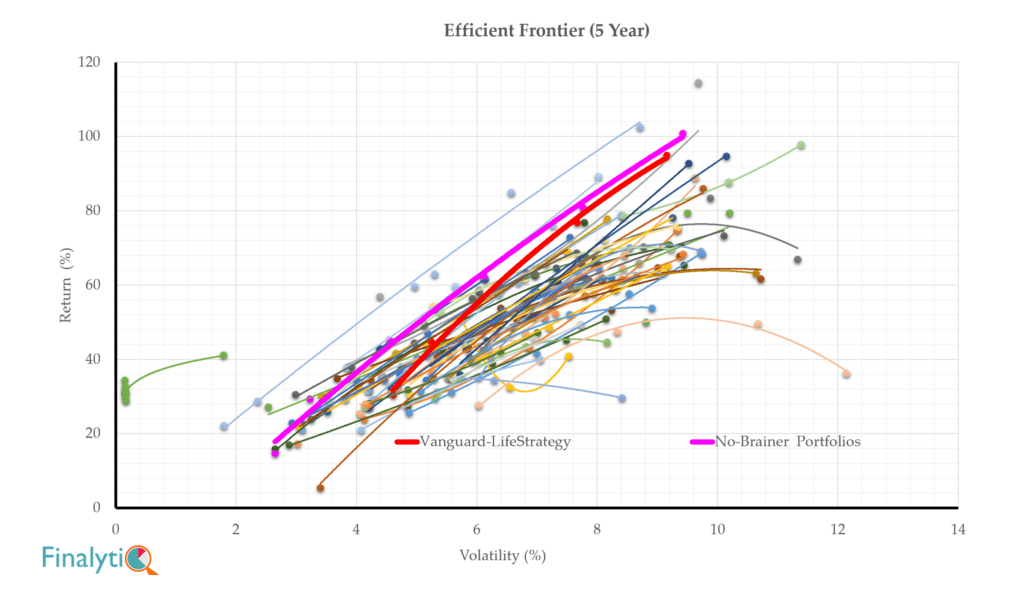
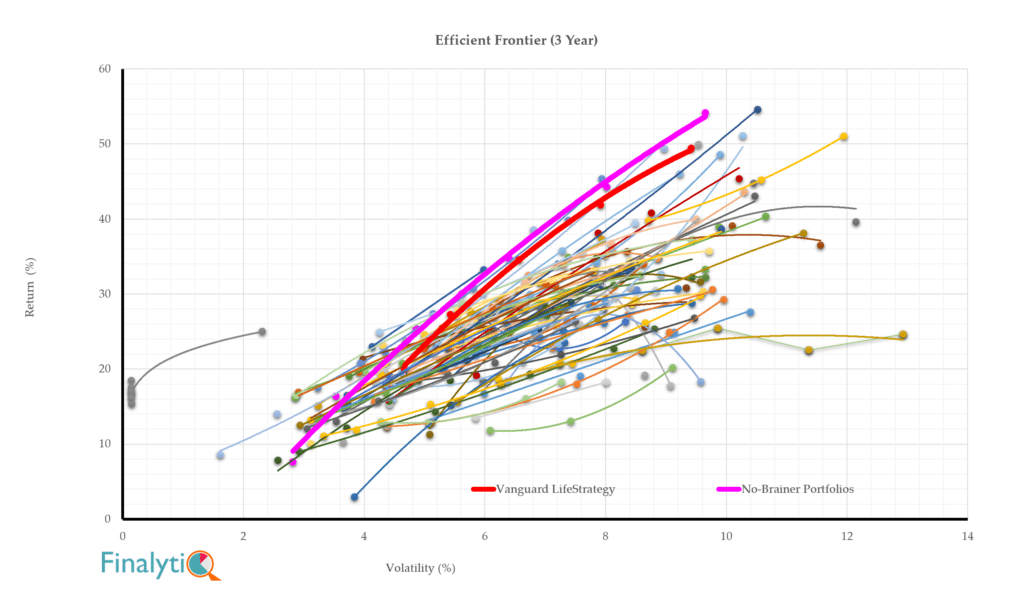
The charts below show that the Efficient Frontier of multi-asset fund ranges over 3 and 5 years. The Efficient Frontier curve plots the level of return delivered across each fund range against the unit of risk taken to deliver this return. The Efficient Frontier curve for each fund range shows how clients are systematically rewarded for every unit of risk (volatility) they take.


This means:
- each No-Brainer Portfolio represents a more optimal Efficient Frontier than virtually all the multi-asset propositions
- each No-Brainer Portfolio outperformed virtually all the corresponding funds in the same risk profile on a risk-adjusted basis over three and five years
- each Vanguard LifeStrategy Fund (i.e. 20, 40, 60, 80 and 100) outperformed virtually all the corresponding multi-asset funds over three and five years
For the second year running, we find that the vast majority of multi-asset fund ranges have a sub-optimal Efficient Frontier when compared with our benchmark market portfolio dubbed No-Brainer Portfolio.
- Of all the 58 fund families that have five years’ performance data, 56 underperformed the market portfolio benchmark net of fees.
- 23 of the 25 multi-asset fund ranges with 10 years’ performance data underperformed the benchmark portfolio.
Risk-rated multi-asset funds continue to play a vital role as part of the investment proposition for many advisory firms. For some firms, multi-asset funds are the primary proposition for most clients enabling advisers to completely delegate the asset allocation and fund selection process. For others, multi-asset funds are used only for a specific client segment, typically the lower-end of the wealth spectrum.
The sad reality is that the odds of real return for a typical investor in these funds (in excess of inflation and cash) are worse than the odds of being struck by lightning! Accordingly, Advisers have an obligation to ensure that funds recommended for their clients are in sync with their needs and represent value for money. By evaluating the entire range or family of multi-asset funds, this report makes it easier for advisers to assess whether multi-asset funds deliver consistent results across the entire range in line with a client’s risk profile.
This guide provides an in-depth evaluation of how risk-rated multi-asset funds deliver on their promise to investors and their advisers.


I am not known as a defender of active managers.But if the No Brainer benchmarks are a mixture of equities and bonds exclusively, they penalise the many managers who chose not to own bonds (or have a lot less of them) when they ceased to present any sort of sensible risk/reward proposition. In diversifying away from bonds into various ‘absolute return’ funds they have not, to date, been rewarded for what I would argue was sensible risk management.
As the yields on many bonds headed towards zero managers were well justified in choosing not to own them – a lousy yield and the possibility of losing money if/when yields rose. The No Brainer models could be running the next stretch of the race with the wind in their face as bond yields rise.
I’d be more interested in seeing the analysis done over a longer time-frame. Five years of a Bull market is too short a period to undertake this exercise over.
Plus multi-asset funds should only be used for relatively small investments. So a few percentage points difference, when extrapolated out to actual pounds & pence, isn’t going to make a huge difference.
Should total cost including adviser ongoing chargers ever exceed 1.5% bearing in mind stakeholder was supposed to be platform and fund without ongoing advice cost? – discuss.