Unless you are lying on the beach somewhere sipping margaritas, you probably saw the headlines reporting the SPIVA Europe Scorecard Study earlier this week, something like… ‘90% of active UK Equity funds beat benchmark…’
You won’t be surprise that these headlines aren’t the whole truth. Not even close. The coverage of the SPIVA study by the mainstream industry media has been shallow to say the least. Hence why I have to step up to the plate…, someone has to do it.
For the uninitiated, the SPIVA (S&P Indices Versus Active Funds) is one of the more rigorous analytical examination the performance of active funds against relevant benchmarks. The study has been running in the U.S for the last 12 years and there are now versions for Canada, Australia, even India! For a very long time, I have wondered why there isn’t a SPIVA study for the UK. Well, that’s until last week when the first SPIVA study for Europe was published.
- Performance
So how did active funds fair in the SPIVA study? A lot better than you’ll expect!
Majority of active fund underperformed the relevant benchmarks in the Global, Emerging Markets and the US equity sectors, no surprise there. The UK Large/Mid Cap Equity sector is a very different ball game though, as most active funds outperformed the benchmarks.
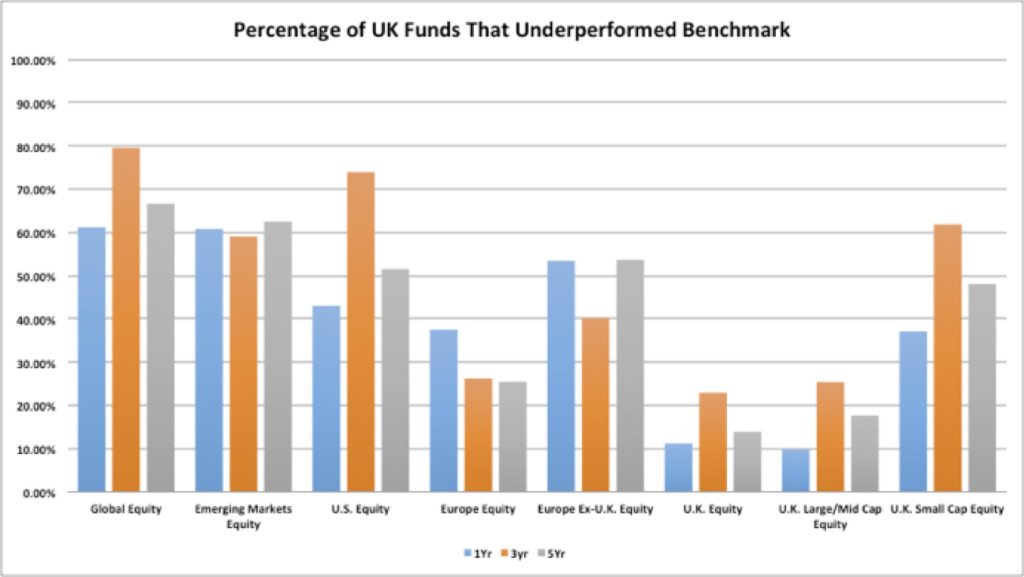
Source: SPIVA, graph by FinalytiQ
This goes against what you would normally expect and there are a number of speculations as to why this is the case. The main one being the fact that the influence of the mega-caps in the UK is much greater than in many European equity markets and UK managers could ‘easily’ beat the benchmarks by titling their portfolios away from these mega cap companies.
Related to this is the idea that SPIVA study does not really account for propensity among active managers to just capture established market premia such as small/value/momentum/profitability premia, which are readily available to investors anyway. Several other studies suggests that when these are accounted for, the result tend to be very poor for active managers.
The report does shatters the myth that active managers tend to struggle in highly efficient markets while they shine in less efficient markets. As we see here, active managers thrived in the highly efficient UK equity market over the last 5 years, but they have failed woefully in Emerging Markets. Bear in mind though, the last 5 years have been one of the strongest bull markets in modern history and it does makes sense to avoid jumping to conclusion until we see what happens when the study covers a full market cycle.
- Survivorship
The SPIVA study also looks at the proportion of funds that survived each time period. And the result isn’t very good.
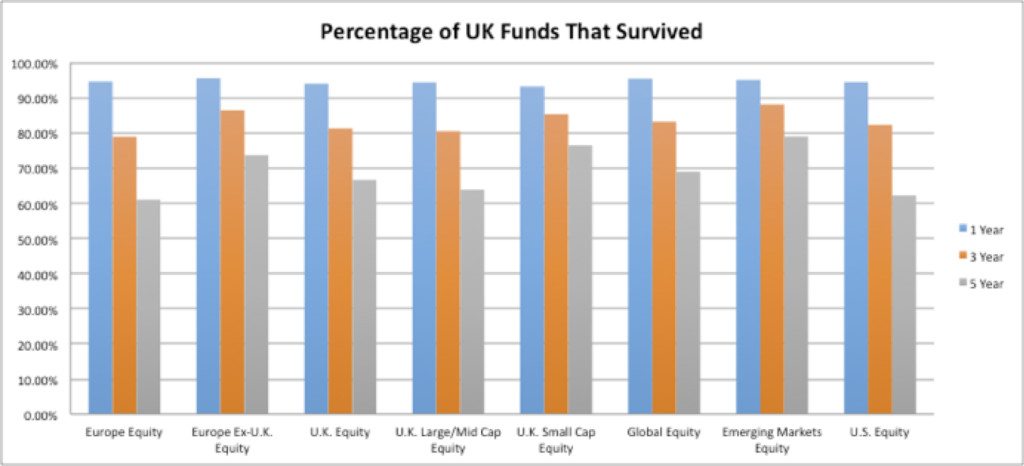
Source: SPIVA, graph by FinalytiQ
Around 1 in 5 funds disappeared within 3 years of launch and a third disappeared over a 5 year period. Here is a good question, what is the chance that a fund you pick today will survive the next 5 years, let alone 10 years?
So what’s the score? Well, it’s hard to call, although I think the active camp will be feeling rather smug, given the rather good showing in the UK equity sector. But this is only the first SPIVA study for Europe, so let see if that smugness lasts.

Read Full Bio
The better performance of the UK active funds over trackers is entirely explained by the fact that in the IA UK All Co and UK Eq.Inc. sectors the active funds hold approx 50/50 Largecap/Midcap and smallcap shares, while the trackers Morning Star is comparing them against are FTSE100 and FTSE Allshare, which between have an average of 90% largecap. There is only one FTSE250 tracker in those sectors.
For a realistic comparison Morning Star should compare the active funds against a blend of those two indices