Well over £80 billion of people’s assets are invested in risk-rated multi asset funds! Sadly, the current fund analysis tools are grossly inefficient for assessing an entire multi-asset fund range/family, as opposed to focusing on individual funds in isolation. Well, that’s until now.
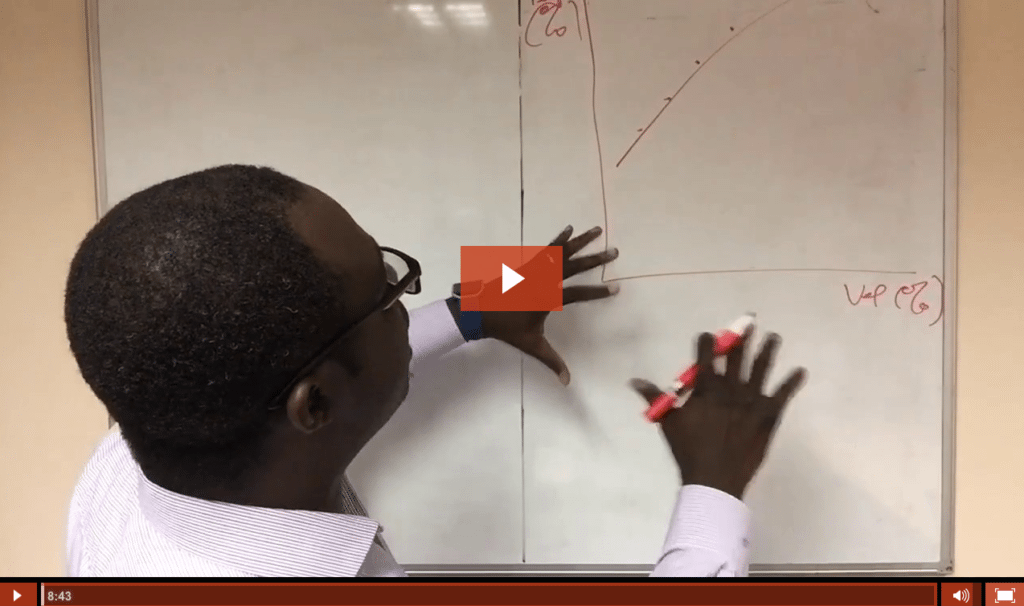
In this new video I talked about my frustration with risk-rated multi-asset funds and how I came up with a simple visual way to benchmark these funds.
.

Abraham is the founder of FinalytiQ, a research consultancy for platforms, asset managers, and advisory firms. Recognised as one of the country’s leading experts in retirement income, platforms and investment propositions, Abraham has authored several papers on these subjects and delivered talks to the Personal Finance Society, The FCA and several conferences across the country.
He holds a Master’s degree from Coventry University and an alphabet soup of qualifications, including the Investment Management Certificate, Chartered Financial Planner, CFP and Chartered Wealth Manager designations. He was one of 5 finalists for the Professional Advisers Personality of Year Award 2015 but the award went to a more deserving winner, obviously!
Read Full Bio
I remember the old adage on Bloomberg TV: Apple shares “are going up” showing a graph with the performance from the morning trading when in reality the pundit should have said Apple shares “have gone up”. Probably this is best to attract more punters, but this is TV.
The same for you, if you do not mind a bit of criticism. Instead of analysing how these funds “are performing”, you analyse how they “performed” in the last 1 year, 3 years, 5 years etc.
I do not like past performance analysis unless it is explained why the funds performed the way they performed in a qualitative analysis. There are three main reasons for the performance of these funds: charges, assets allocation and fund/stock selection. You may add to that the effect on performance of timing the market or what the pundits name “dynamic” asset allocation, although my research showed this always had a negative effect on performance.
1. Charges always make a big difference, the cheaper range i.e. Vanguard was probably one of the best performing range.
2. Asset allocation could make a difference, for example Dimensional allocation to value stocks, emerging markets and short duration had a negative impact in the last 3 years due to better performance from developed countries, better performance from the growth and quality factors and long duration bonds, however this does not mean it may not change for the next 3 years.
3. Stock/fund selection – my personal opinion from qualitative research on these multi assets funds is that investment manager do not add value by stock/fund selection. At Montfort we added immense value from fund selection in our range of minimum variance portfolios because we are nibble – we only manage £110 million in total. This gets harder as you have more and more assets under management and charge higher as these big aggregators do.
Obviously past performance is no guarantee or give any indication on future performance and whatever we do: asset allocation, fund selection, timing the market could have been successful in the past but adding negative value in the future.
To present PAST performance I prefer to be honest the ARC presentation (having a line between cash (0.25% per annum, although ourselves we use 1% per annum as the NS&I income bond pay) and MSCI Word Index TR) on which you could add your little arcs with the performance of every multi asset house in the land.
What do you think?