Managing retirement income portfolios is riddled with old wives’ fables; practices handed down from adviser to adviser but with very little empirical basis. (Really, these practices are often promulgated by men, so the term ‘old men’s fables’ is probably more appropriate but that doesn’t roll off the tongue. But I digress)
One of such practices is the idea that holding large cash reserve in a retirement portfolio helps mitigate sequence risk and improves the sustainability of a retirement portfolio. The reasoning is that, by holding 2 to 5 years worth of income in cash, you avoid selling down equities during poor market conditions. This should subsequently prevent pound cost ravaging and improve the longevity of the portfolio.
Prior research has shown that holding a cash reserve does not improve portfolio longevity in retirement. (See Bill Bengen’s 1997 paper titled Conserving Client Portfolios During Retirement, Part III, and an extensive research by Walter Woerheide and David Nanigian. ) Since there are several different versions of the cash buffer approach, many of its proponents continue to suggest that their approach works. So in this research, I set out to test 11 different cash buffer approaches using the DMS database, with 117 years of data from 1900 – 2016!
The Test
I set up a control portfolio with 50% global equities and 50% global bonds. This is our fully invested portfolio. Then, I set up the cash buffer portfolio with 40% global equities, 50% global bonds and 10% cash. The cash allocation represents just over two years’ worth of income for a traditional initial withdrawal of 4%.
Now, there are many ways to apply the cash buffer rule and here are the ones I tested:
- Withdraw evenly across all asset classes and rebalance annually. This is the baseline approach, against which we judge the others.
- Withdraw evenly across all asset classes and rebalance every two years
- Withdraw evenly from the portfolio and rebalance when any asset class deviates from the original allocation by more than 5%
- Withdraw evenly from the portfolio and rebalance when any asset class deviate from the original allocation by more than 10%
- Withdraw evenly across all asset classes but do not rebalance
- Draw cash first, then bonds, then equities and rebalance every two years
- Draw cash first, then bonds, then equities but no rebalancing. Asset classes are not replenished once depleted. This is in effect a rising equity glide path, which means that percentage allocation to equity increases as you spend down bonds.
- Draw equity first, then bonds, then cash but no rebalancing. Asset classes are not replenished once depleted. This is in effect a falling equity glide path, which means that percentage allocation to equity falls as you spend it down.
- Draw cash and only rebalance when equities are up. This means you avoid selling equities after a bad year. If cash runs out, then draw bonds.
- Draw the best performing asset class each year but no rebalancing.
- Draw the worst performing asset class in the previous year but no rebalancing
So, by the power of arithmetic, that’s eleven different ways of draining assets from your portfolio! And as we have two separate portfolios – a fully invested portfolio (i.e. 50/50) and a cash buffer portfolio (i.e. 40/50/10), that’s 22 different approaches in total. Yikes!
Like this? Join us at the Science of Retirement Conference for research-based insight on retirement income planning!
The Metrics
Now, how do we measure which approach is better? What constitutes a good outcome in retirement? For this, I used the following metrics
- Success Rate: the is the percentage of historical rolling periods where a given strategy ended with a balance of more than £1 at the end of a given period. In this research, I looked at the success rate for 25, 30, 35 and 40-year rolling periods.
- Portfolio Longevity: This is the number of years the portfolio lasted in the very worst and the 10th percentile scenarios. The purpose of this is to see which strategy extends the longevity of the portfolio under severe market conditions.
- Median portfolio balance in year 30: This metric gives us some idea of which strategy ended up leaving the most legacy at the end of 30 years of withdrawal.
The Result
First, let’s look at the result of the 50/50 portfolio with global equities/global bonds. There is no cash reserve here. The annual withdrawal is taken directly from the asset classes, depending on the rule applied.
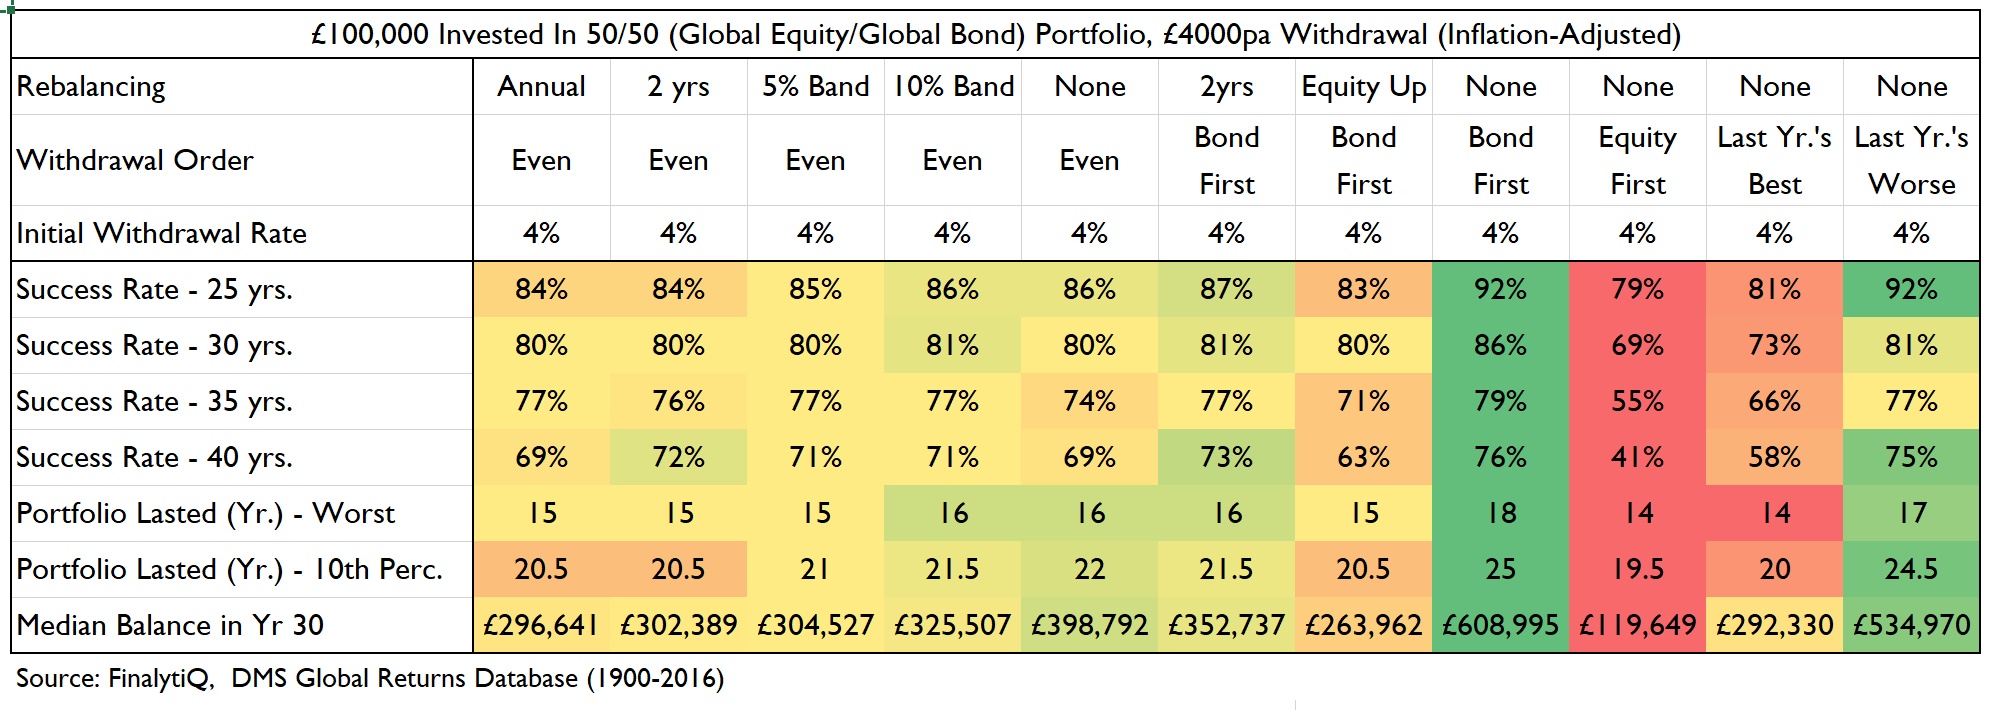 One thing that is obvious here is the interaction between the rebalancing methods and the withdrawal order. If withdrawals are taken evenly across asset classes (i.e. based on percentage allocation), there is very little difference in the various rebalancing methods regarding success rate and portfolio longevity. However, in the non-failure scenarios, rebalancing less frequent seems to result in larger legacy at the end of 30 years.
Interestingly, withdrawal order that avoids selling down equities at all (i.e. depleting your bond allocation first and spending previous worse performing asset class which is most often is the bond) without any form of rebalancing results in the best outcomes for success rates, portfolio longevity and the size of the legacy! In essence, this is a rising equity glide path because you increase the percentage equity allocation (and the portfolio volatility) over time by spending down the bonds without replenishing it through rebalancing!
Now, what does the result look like for a portfolio with 10% cash, 40% equity and 50% bonds?
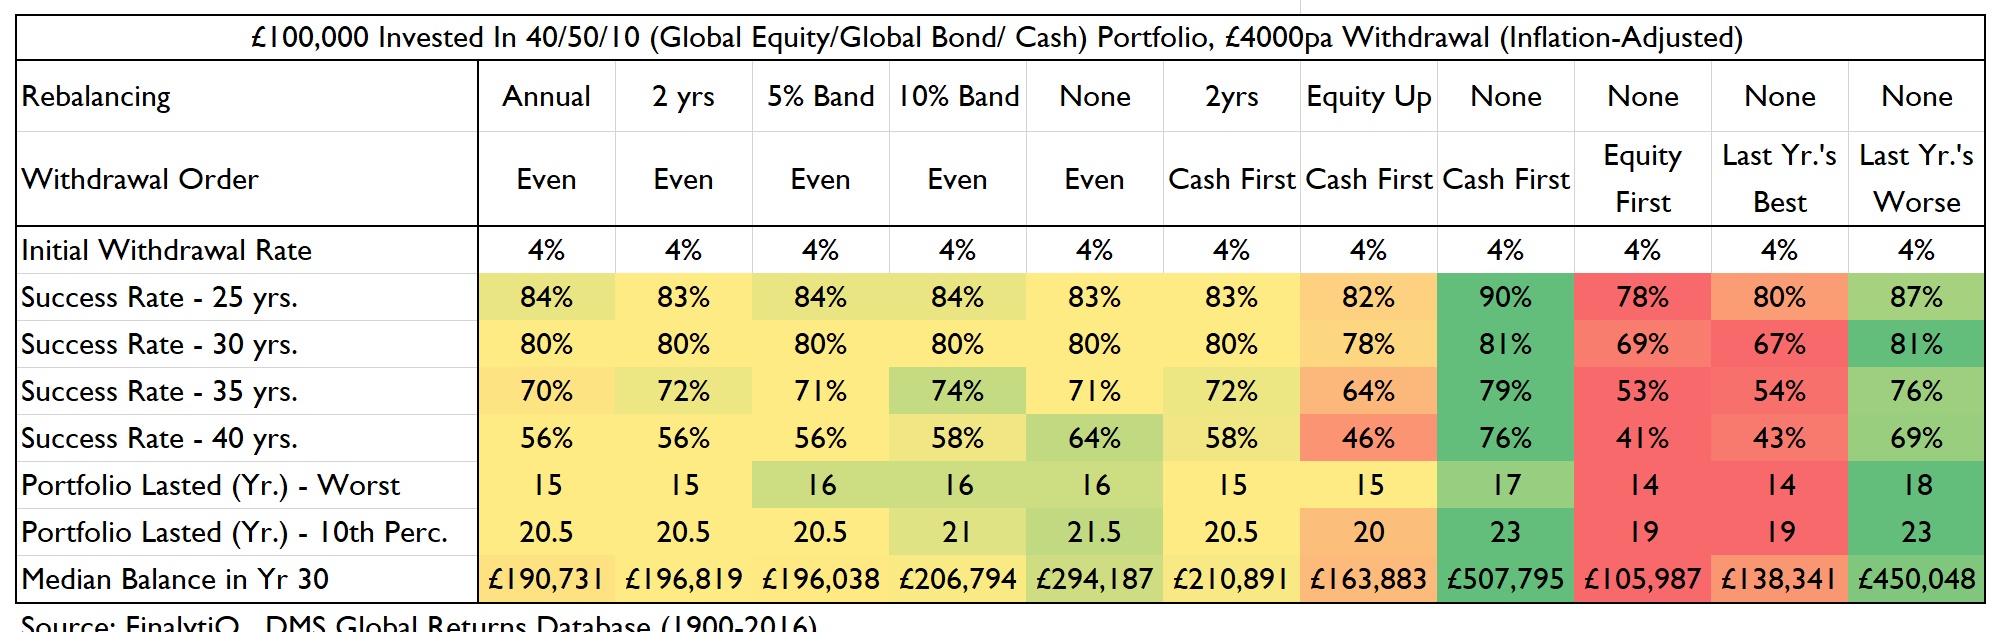
Across all the strategies, replacing equity with cash offers no improvement in the success rate or portfolio longevity! Crucially, the success rate is meaningfully lower for 40 year retirement periods, and it resulted in a significant reduction in the size of the legacy at the end of 30 years in the non-failure scenarios!
What’s the lesson here? Replacing equity with cash, however way you do it doesn’t mitigate the sequence risk in a retirement portfolio.
If you must?
There is, of course, a necessity to hold a cash reserve in a retirement portfolio; for behavioural reasons and to pay fees. Clients are less likely to panic-sell in a bear market if they have two years worth of income in cash. So, while cash might not help mitigate sequence risk, it does help with mitigating stupidity risk!
So, what if we replace bonds with cash? What if we hold a 50/40/10 allocation in global equity/bond/cash?
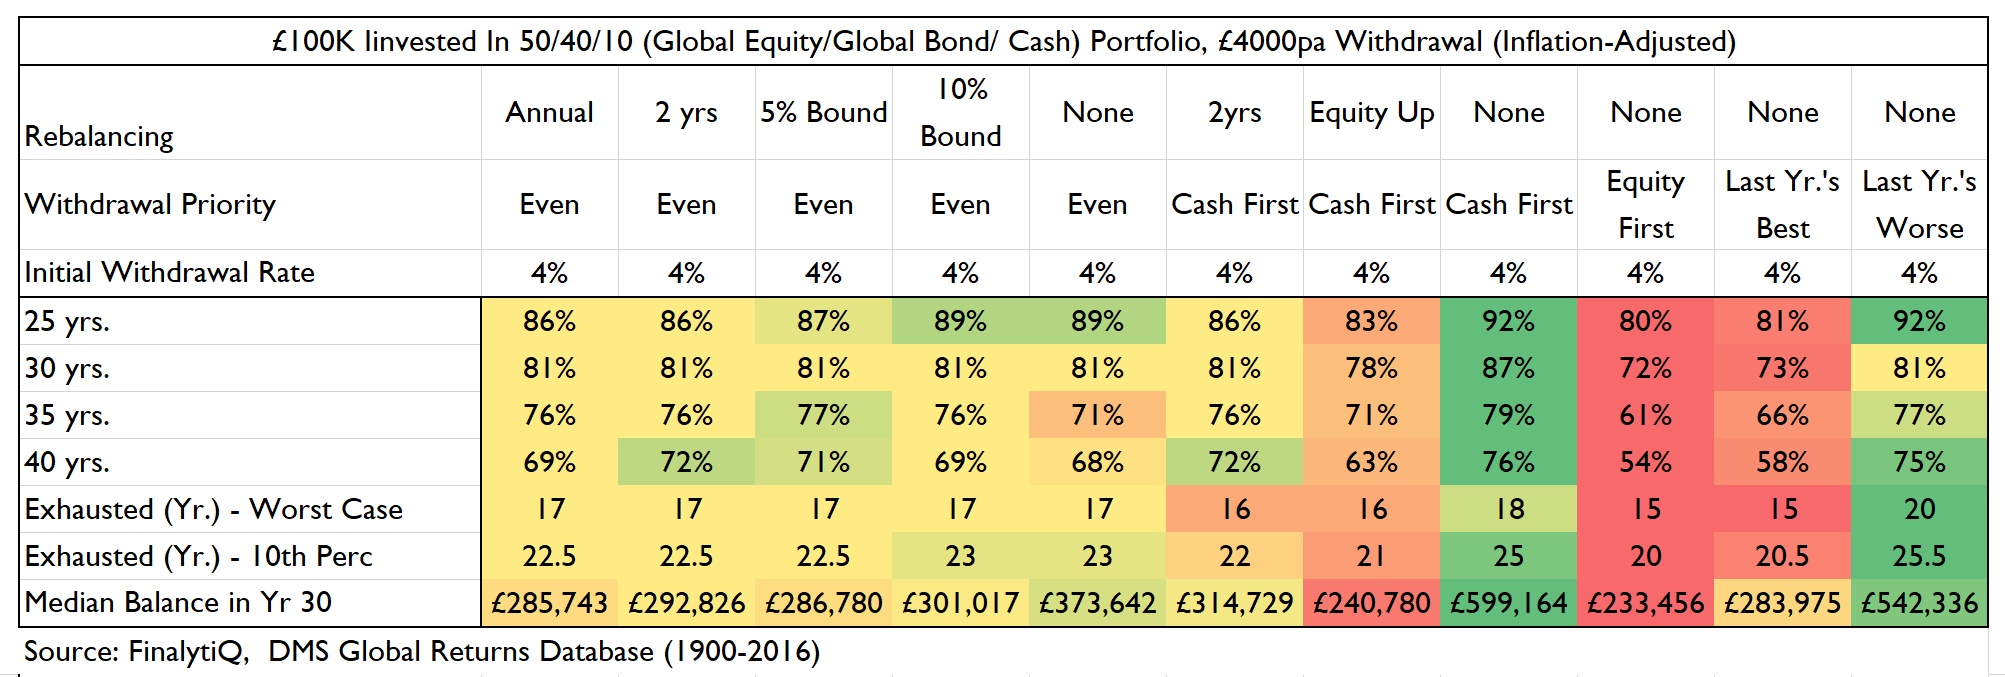
Replacing bonds with cash appears to improve the portfolio longevity in the worst-case scenarios. There is hardly any difference in the success rate compared to a fully invested portfolio. There is a price to pay regarding legacy in the non-failure scenarios, but I’ll wager this price is worth paying.
So it makes sense to replace the bond allocation with a little bit of cash. The key here though is not to overdo it. I have heard tales of advisers holding five years’ worth of cash (by reducing equity allocation). This approach doesn’t work unless you increase the equity allocation significantly in the rest of the portfolio to compensate for the cash drag. In any case, replenishing the cash reserve through systematic rebalancing will likely result in poorer outcome than a fully invested portfolio.
I examined the results using UK equities and UK bonds instead of the global equities and bonds, and the key findings are consistent.
The point here is, if you’re going to implement a cash reserve buffer, take it from your bond allocation. Equities aren’t the enemy!
Like this? Join us at the Science of Retirement Conference for research-based insight on retirement income planning!
.

Read Full Bio
Great stuff Abraham! On the basis that for a 30 year retirement a 50% bond weighting dooms the client to run out of capital from the outset, I would love to see these figures for an 80:20 or 90:10 weighting to equities. Be an owner not a loaner!
Well done Abraham, thank you for sharing!
Excellent article, Abraham. I did a study using US stocks and bonds since 1871 and found the same – no cash consistently provided a more reliable retirement than any amount of cash. There are some cases with small amounts of cash that it does not hurt – but there is no case where holding cash made a retirment more reliable. My study is about 2/3 through my article here: https://edrempel.com/reliably-maximize-retirement-income-4-rule-safe/ .
Ed
Great content/subject Abraham. My own limited studies indicate similar, but you’ve provided the proof that we can all use.
Thank you.
Tony
Interesting reading. I wonder if the difference between the cash buffer portfolio and the fully invested one would widen if you account for up to 1.5%pa of platform and advice charges being paid from the cash buffer instead of paid by selling units. This control of when you sell units to pay charges is the fundamental advantage of a platform over a supermarket or insured contract.