Everywhere you turn these days, there’s talk of asset class ‘bubbles.’
Apparently, we’ve got a bond bubble. An equity market bubble. A property price bubble. A Bitcoin bubble. Oh, and a passive fund bubble! Hell, we’ve got a bubble of bubbles!
It’s not hard to understand why many think equity prices are elevated, and a ‘crash’ will inevitably follow. We’re now over eight years into the current bull market, and there are increasing concerns that equity valuations may be too high.
Get your CAPE on!
One of the more reliable valuation metrics is the Cyclical Adjusted Price Earnings (CAPE) ratio. It was created almost 30 years ago by Nobel Prize winner Prof. Robert Shiller and his colleague Prof. John Campbell. The CAPE ratio is the inflation-adjusted stock price, divided by the previous ten year average of real earnings.
An above average CAPE ratio is typically followed by below average equity market return over the next 10 years, and vice versa. The chart below shows the CAPE ratio for UK equity since 1927. It’s plotted against the annualized real return over the following 10 years of each date shown.
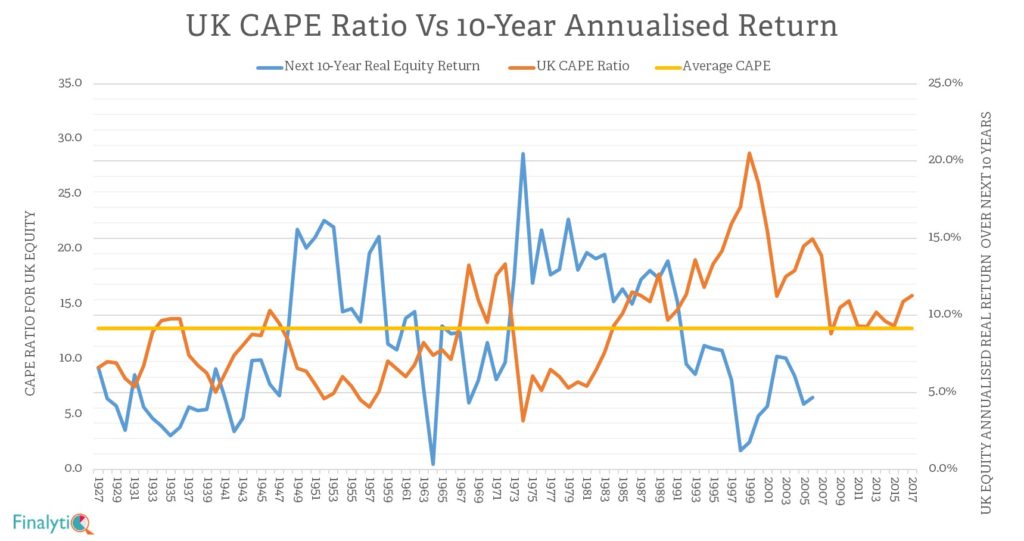
The CAPE ratio for UK equity is now 15.8 (as at May 2017), compared to the historical average of 12.8. The current level is not the highest we’ve seen. It ranks in the 77th percentile, which means CAPE has only been higher than the current level in 23% percent of times since 1927!
The CAPE ratio for the US stock market is a little more worrying. It’s currently above 30, compared with an average of 16.8 since 1881. It’s been above 30 in only two other periods: in 1929 when it reached 33, and between 1997 and 2002, when it soared as high as 44! Both of those instances were followed by a very sharp decline in equity prices.
This has caused pundits to question whether we’re due another sharp decline in the stock market. Sadly, as useful as CAPE is, it doesn’t lend itself to crystal ball gazing in the way that many pundits are using it.
One way to test the predictive power of CAPE is to look at the R2 between CAPE and the annualized real return over the following 10 years. For the UK, the R2 is 22.6%. This means that CAPE only explained 22% of the variability in real returns on UK equities between 1927 and 2016. The predictability of CAPE is somewhat higher for the US equity market, with an R2 of 35%, as calculated by Prof. Jeremy Siegel, using data between 1881 and 2014.
Yet, there’s a lot about equity returns that’s unexplained by CAPE – or any other equity valuation metric.
Indeed, the father of CAPE himself admitted in a recent article that;
‘…current valuations make the market vulnerable. But it took more than high valuation numbers to precipitate those ugly declines in the past. The other ingredient was mass psychology….
‘Why people are so calm about the high-priced market is a bit of a mystery. On this, I can only speculate. Perhaps investors have been distracted by the endless flow of news about Donald J. Trump, North Korea, the back-to-back hurricanes and so much else. I don’t really know.
But the result is that while valuations remain very high there just doesn’t seem to be much evidence that many investors in the United States stock market are actively worrying today that other investors are on the verge of selling. Mass opinions may well change, but for now, in the critical psychological dimension, the stock market does not closely resemble the market in the dangerous years of 1929 or 2000.’
Mass psychology is fickle and much harder to measure. It’s the drawer we put those things in that impacts equity market returns. But they can hardly be measured in numbers!
[bctt tweet=”There’s a lot about equity returns that’s unexplained by CAPE – or any other valuation metric.” username=”AbrahamOnMoney”]
So, is CAPE useless then?
No, it gives us a vague idea where we are in the market cycle. Above average CAPE implies that we should probably expect a below average real return over the next 10 years. All it really tells us is the probability that equity returns are likely to be below or above average over the longer term. By the very definition of ‘average’, we should expect returns to fall somewhere above and below the average!
A recent Vanguard paper, which looks at the predictability of various metrics including CAPE and traditional PE ratios suggests how we might use CAPE;
‘The fact that even P/Es—the strongest of the indicators we examined—leave a large portion of returns unexplained underscores our belief that expected stock returns are best stated in a probabilistic framework, not as a “point forecast,” and should not be forecast over short horizons.’
Bull in a China shop!
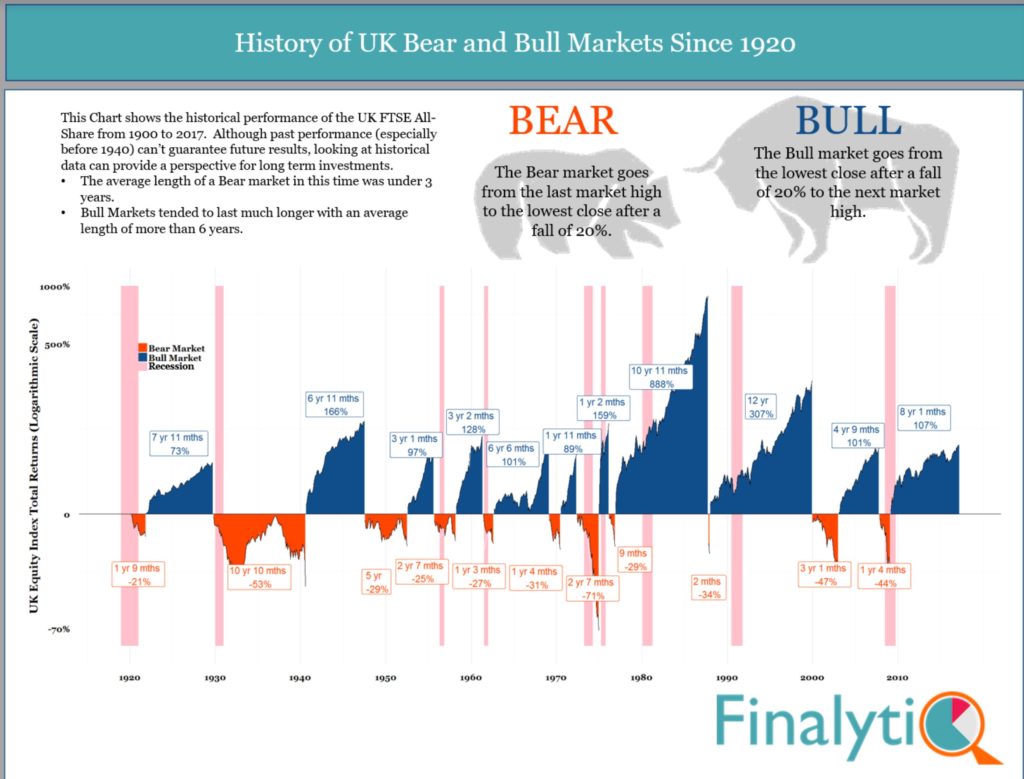
The current bull market is the third longest one we’ve seen in history since the 1920s. It’s the fifth highest in terms of cumulative return. Given the cyclical nature of returns, the tide has to turn at some point. ‘But of that day and hour knoweth no man, no, not the angels of heaven…’ to misquote the good book.
Trying to predict exactly when equity markets will experience a sharp decline is a fool’s errand. Even the Legendary Warren Buffet admits he hasn’t a clue on this in a recent letter to shareholders;
Moreover, the years ahead will occasionally deliver major market declines – even panics – that will affect virtually all stocks. No one can tell you when these traumas will occur – not me, not Charlie, not economists, not the media. Meg McConnell of the New York Fed aptly described the reality of panics: “We spend a lot of time looking for systemic risk; in truth, however, it tends to find us.”
If you try to avoid a potential fall in stock prices by staying out of the stock market, you’ll almost certainly miss out on too much return in the process.
I’ve no idea if we have a stock market bubble or if it’s about to burst! Neither do you. One thing I’m fairly certain of is that the one bubble that needs busting is the inflated ego of those who think they can predict what equity markets will do next!
[bctt tweet=”One bubble that needs busting is the inflated ego of those who think they can predict what equity markets will do next! ” username=”AbrahamOnMoney”]
.

Read Full Bio
Like every other measure CAPE has its own problems. First it is a backward looking measure. It is like trying to drive a car by only looking into the rear mirror.
The recent CAPE figures are also affected by the earnings in the 2008-2009 when all the banks had huge written offs, as a result the average of earnings for the last 10 years are rather low.
Earnings of companies are determined by IAS and GAAP standards and these change quite frequently. These are accountancy measures and not the best to use to determine the stock prices in the first place. In reality investors pay a discounted price of future free cash flows which are either paid as dividends or reinvested in the business.
UK companies seems to have a long term problem with productivity and increasing earnings. As one investment manager was telling me, they are rather poorly managed and many are value destroyers.
CAPE and all other indicators like q are a lot higher in the US, so you may think we have a bubble there. I just do not know.
To forecast a drop in the stock markets, you need to forecast a recession – which is a hard to impossible job too. I think recessions are mostly monetary issues these days than it used to be in the past an increase of supply which surpasses the demand.
Good to hear both Abraham and Eugen’s opinions. It reassures me that others are talking rollocks as I was thinking simialr to you two, but am not as clever/academic, it just appears common sense and I like common sense and so do my clients and that is what they employ me for.