INTRO

The Great Migration Spectacle
THE OVERVIEW
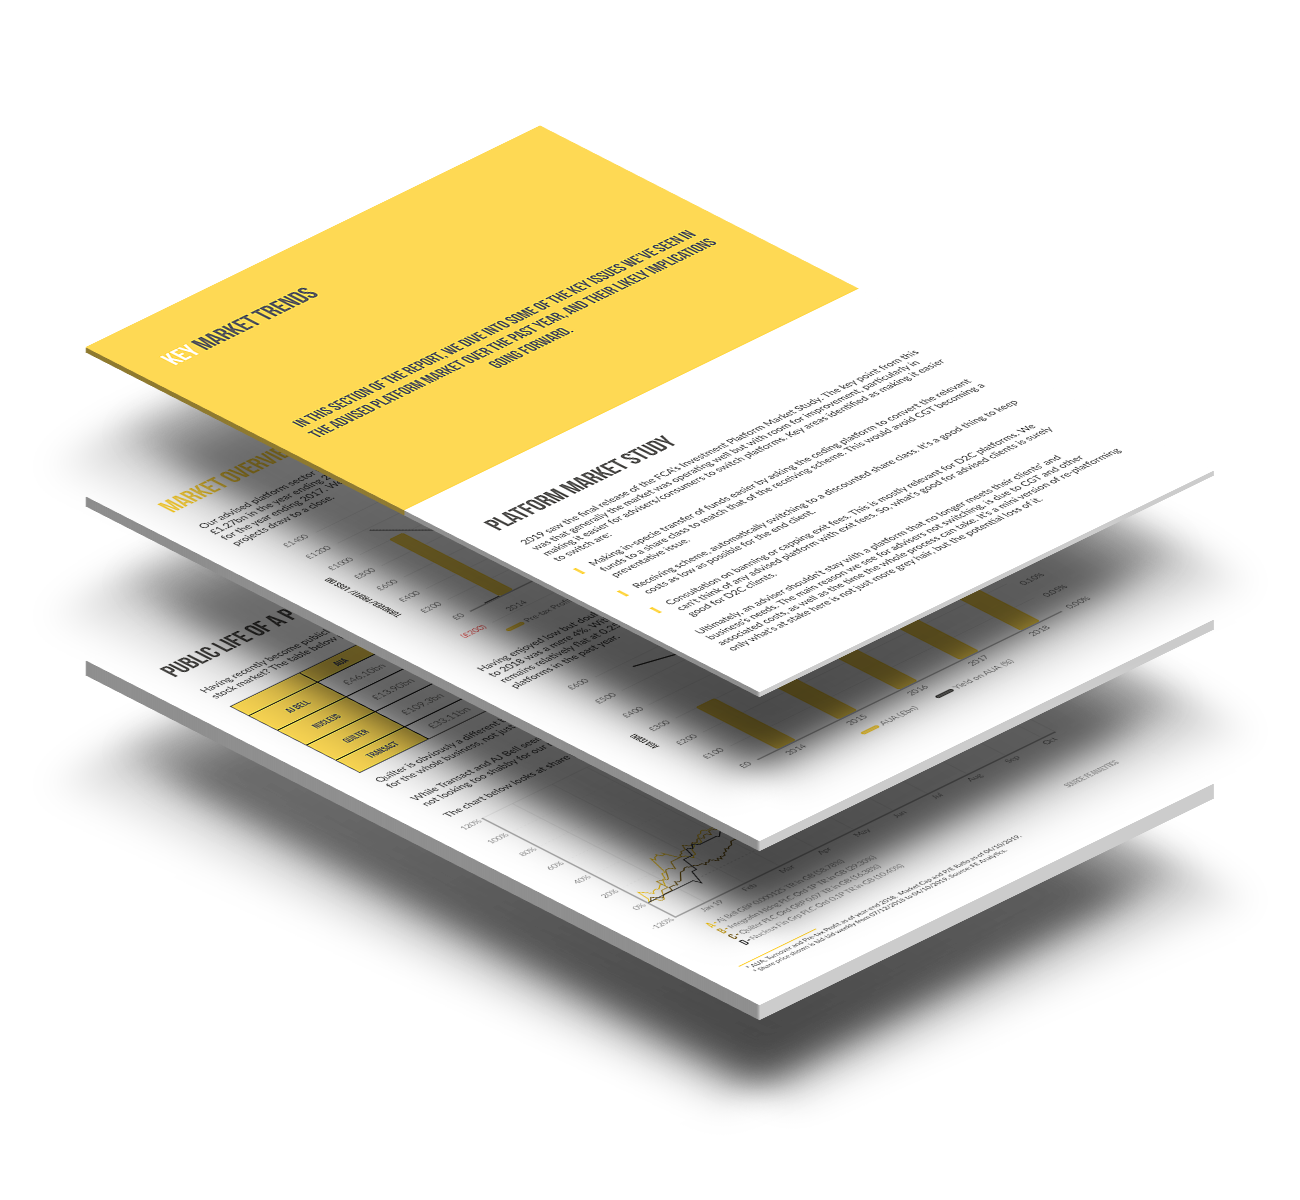
This guide provides in-depth insight and analysis of the financial performance of 21 advised platforms over the last five years.
WHAT’S COVERED
The platforms covered in this report together account for more than 95% of the total AUA in the adviser market.
OUR EXAMINATION
We examine key metrics to give a clearer picture of the financial health of platforms – AUA, revenue, pre-tax profits/losses, yield on assets and profit and loss (P&L) account reserves over the last five years.
THE FOCUS
The guide focuses on the financial performance of platform businesses, not their parents’. We’ve trawled through who-knows-how-many annual accounts and hundreds of data points to get a good picture of the financial health of the platform sector.
Method in the madness
We put platforms in peer groups to get an understanding of whose cost base is out of control, and we look at P&L account reserves to see who has a hole in their books. And yes, the infamous FinalytiQ Financial Performance Rating is back! We rated the platforms, and we provide a summary of the financial health of each business.
Most platforms have a year-end date of 31 December. We’ve compiled data for years ending 2014, 2015, 2016, 2017 and 2018. But there are some exceptions, and we had to compromise. Where a company’s year-end is before 30 March, we use accounts filed the following year. Of course, this means that results for some platforms extend over a slightly different period, due to factors like changing account year end. That can’t be helped.

method

